Transforming data insights into fundraising success for startup founders.
Seedrs / Republic · Six minute read

Summary
Startup founders needed help to engage and convert potential investors effectively during the crowdfunding round. The founders had access to a CSV of contact details for these potential investors. However, they weren't engaging, which decreased the overall fundraising amount possible.
Creating a dashboard to illustrate the current amount raised and step-by-step actions to engage with potential investors saw increased engagement with the dashboard and with out reach.
Overview
Seedrs is an equity crowdfunding company, intending to democratise early-stage investing for everyone.
In simple terms, giving everyone (not just the folk that know or are in the right circles), the potential to make a bit of cash from giving small companies some money.
Seedrs was acquired by US firm Republic in 2022 for $100m.
Key takeaways
- 1,500 views a month, with the dashboard viewed an average of 5 times a day.
- 186 downloads a month, on average 3 times a day. The download contained potential investors' contact details to enable reaching out for nurturing.
- Founders were reaching out to investors and increasing initial investment value.
Team involved
- 1x Product designer (me).
- 1x Product manager.
- 1x Engineering manager.
- 4x Backend engineers.
- 2x Frontend engineers.
- Design team for crit sessions.
Responsibilities
- Research.
- Exploration.
- Visual design.
- Vision.
Timeframe
2 months
The problem
Founders didn’t understand the opportunity they had or what to do with the information that was available to them. An experiment provided that a founder reaching out to potential investors saw greater engagement with the founder and the fundraising round.
Founders also weren’t aware of how much of the potential investment would actually convert into real investment, as well as how this would impact their overall funding round.
Seedrs staff members were having to tell and show founders to reach out to these potential investors, as well as providing screenshots of internal dashboards that founders requested information about.
The goals
- Increase founder outreach to potential investors. In turn, increase the amount of investment into a campaign.
- Increase founder marketing in the registration phase. Which would increase the attention to the founders’ campaign.
- Decrease questions to staff members, from founders, about the views on their pre-reg page. Meaning staff could work with the founders on other areas of their campaign.
My role
As the sole designer working on this part of the business I did the following:
- Understood the founders’ confusion and wants about this registration phase of the journey.
- Heard from staff members what the founders’ typical requests are about the registration phase.
- Tested with both founders and staff members to understand if the dashboard was meeting their expectations and needs.
- Communication and collaboration with the PM and engineering manager, sharing thinking and progress.
The process
Understand the problem
Taking the time to talk with the founders to hear their perspectives and hearing why they weren’t reaching out to potential investors was insightful. It basically came down to:
- ‘I don’t know who I should be reaching out to’.
- ‘I don’t know what I should be saying to them’.
I sat in on calls between staff members and founders which created more insights. As well as chatting with a group of staff about what common requests are from founders at this stage.
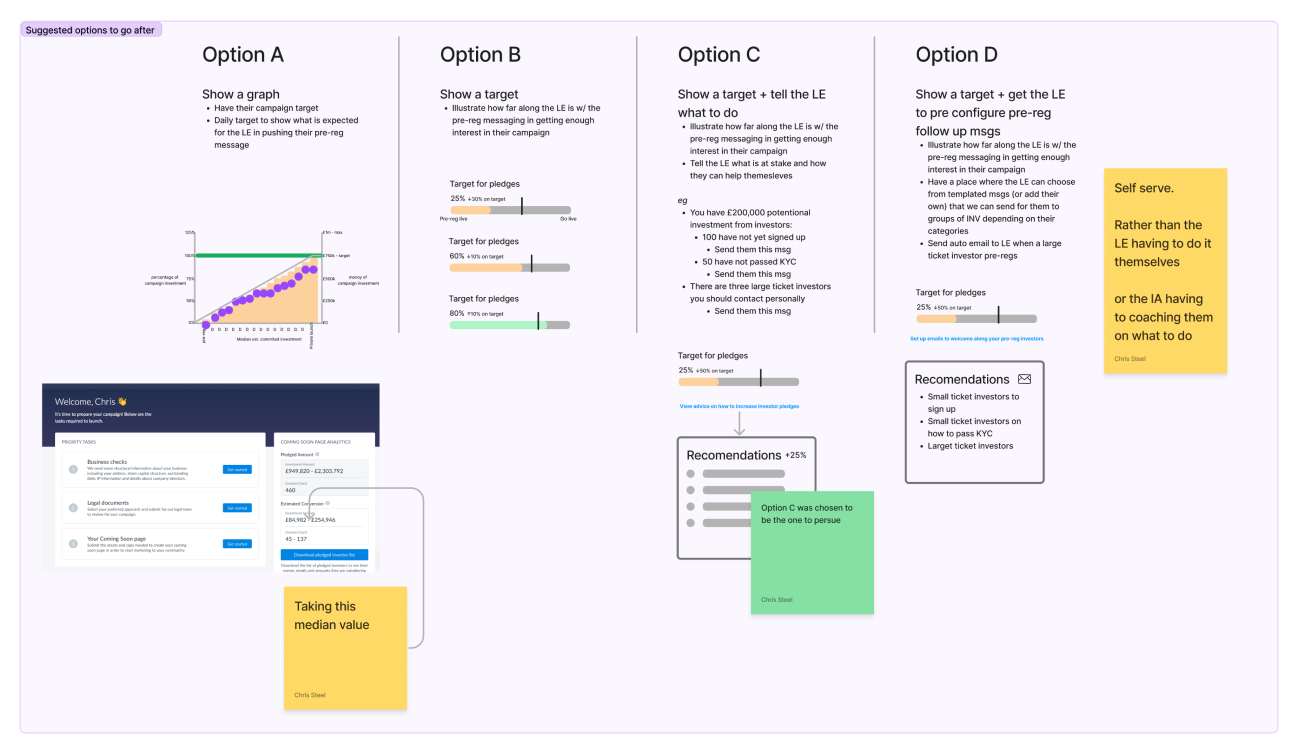
With these findings I took the chance to come up with four options in which we could pursue, all with pros and cons of each, but mainly with a recommendation. I took this to the PM and engineering manager, shared the rationale and heard their thoughts on directions and how we could slice it up the idea to be a deliverable.
Once we were on the same page it was time to sketch and off to do some desk research and see what dashboards I could use for inspiration.
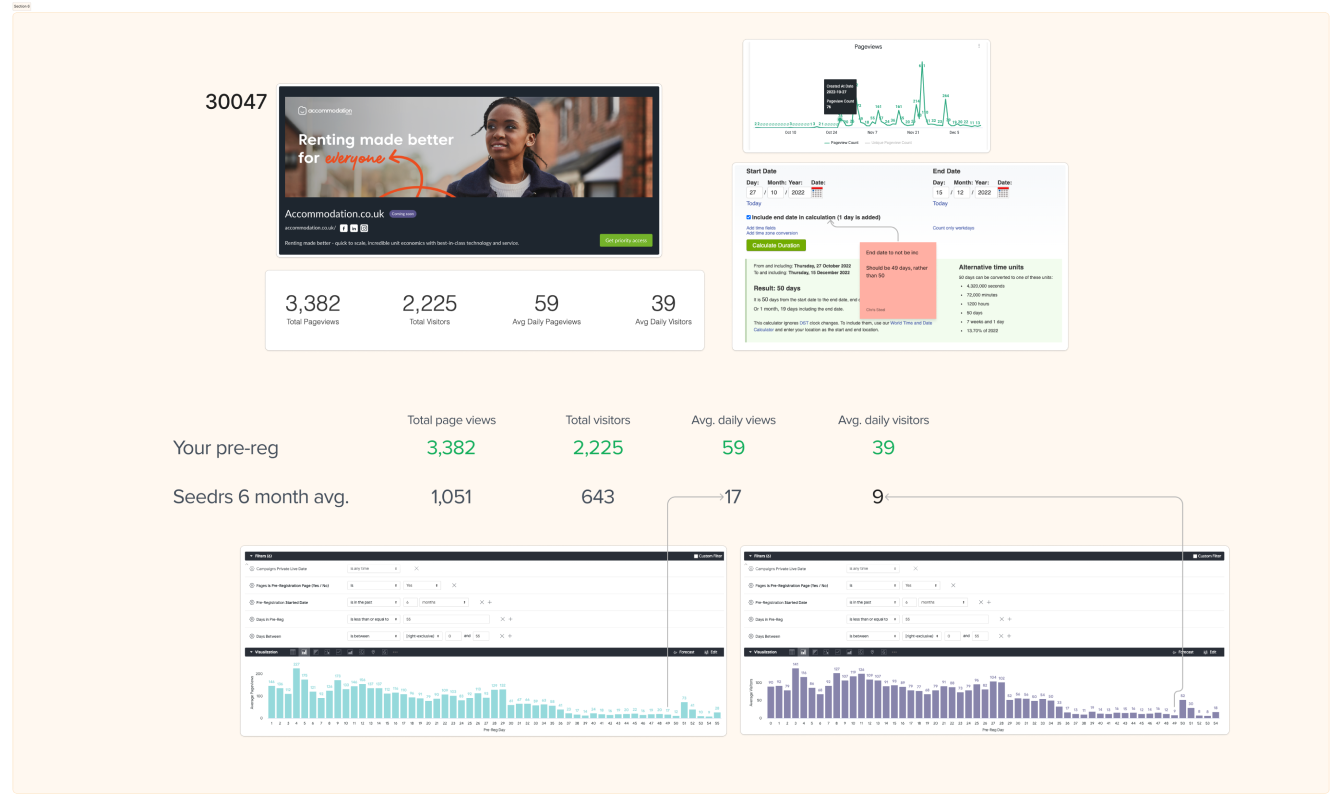
Working through the data with internal dashboards with the data team.
Options to decide from worked through the PM and engineering manager.
Design, test and deliver
Lofi comps were mapped out, I talked with the data team to know how accurate the information we had was. Iterations happened as well as putting it them in front of the rest of the design team for their thoughts on the direction. Chats with the engineers around packages we had access to in the stack were helpful at this point.
Rough ideas around information and placement.
Less charts, more action-centric concept.
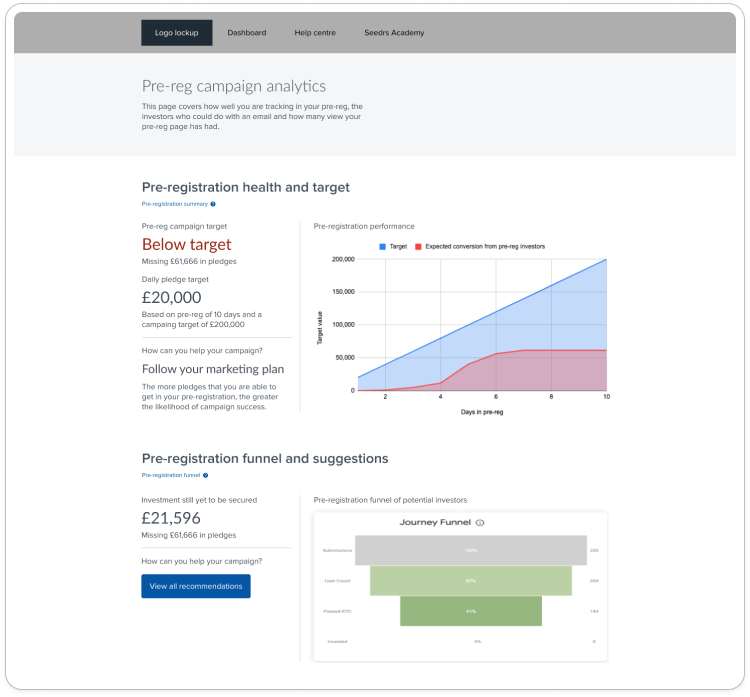
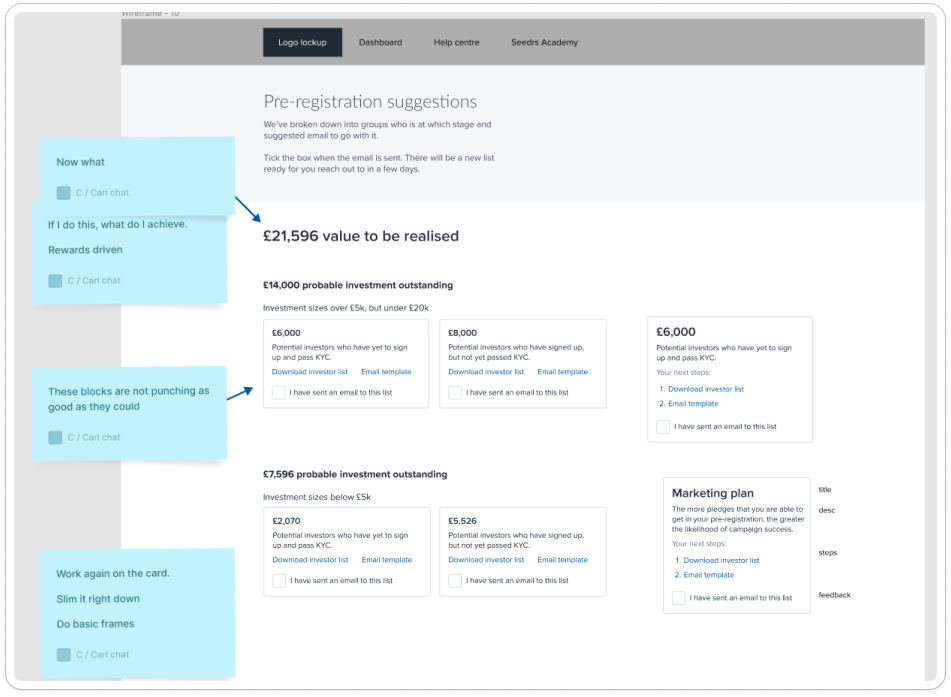
When hifi comps started to come around I got to testing with the founders. Quick calls highlighted more of what they cared about, the founders were taking the actions that I was testing for. Grabbing staff members to hear their thoughts was a great help too. Tweaks occurred from the testing.
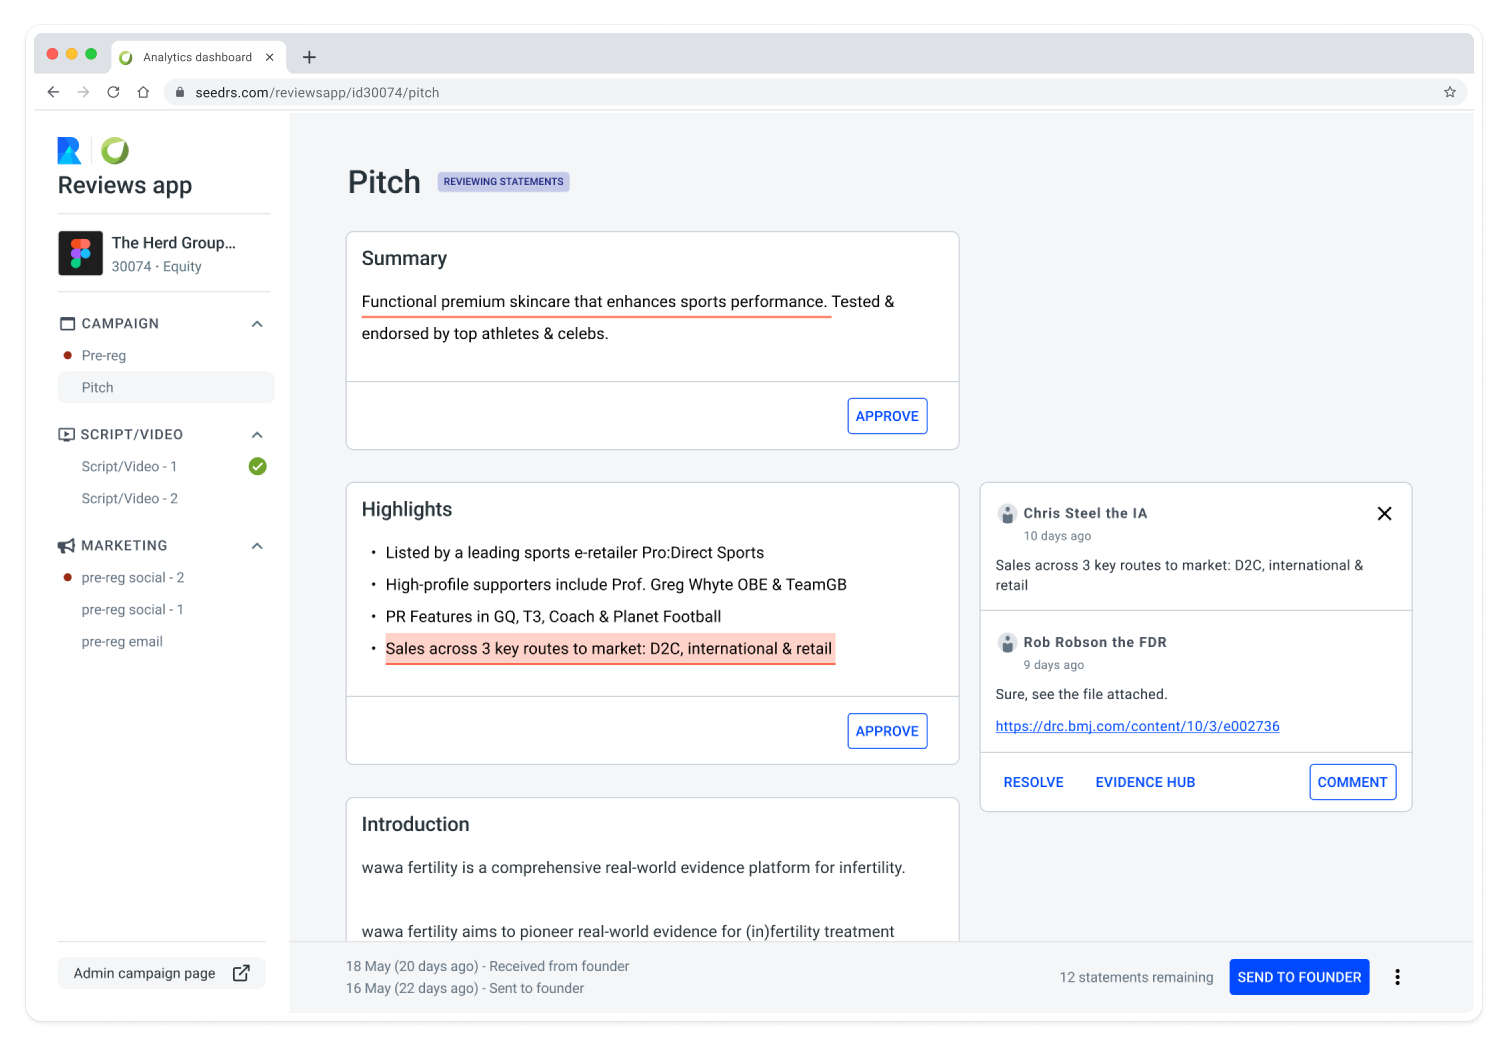
A quick demo of the founder's campaign screen and the dashboard, complete with an info panel and where to find the investor contact details, based on their proposed investment amount.
Outcome
- Dashboard designed, developed and deployed in partnership with the engineering team.
- Investors’ details downloaded on average three times a day (186 downloads a month).
- Dashboard viewed an average of five times a day (1,500 views a month).
- Efficiencies gained for staff members due to less hand-holding of founders and sharing data.
- Increased outreach between founders and potential investors.
Challenges
A challenge that I faced during this initiative was there were no other dashboards around to have as base, this work was all greenfield, from layout to graphs to how to structure the page.
Always referring back to what the founder wanted and what information need to be shared kept the work grounded. Taking inspiration from different places rather than reinventing the wheel made the process run smoother.
Other cast studies
Simplifying regulatory compliance. From spreadsheet chaos to streamlined evidence management.
Outcomes:
- 7 hours saved per FCA request.
- One source of truth, rather than disparate data storage.
- A scalable app that continued to grow and provide value.
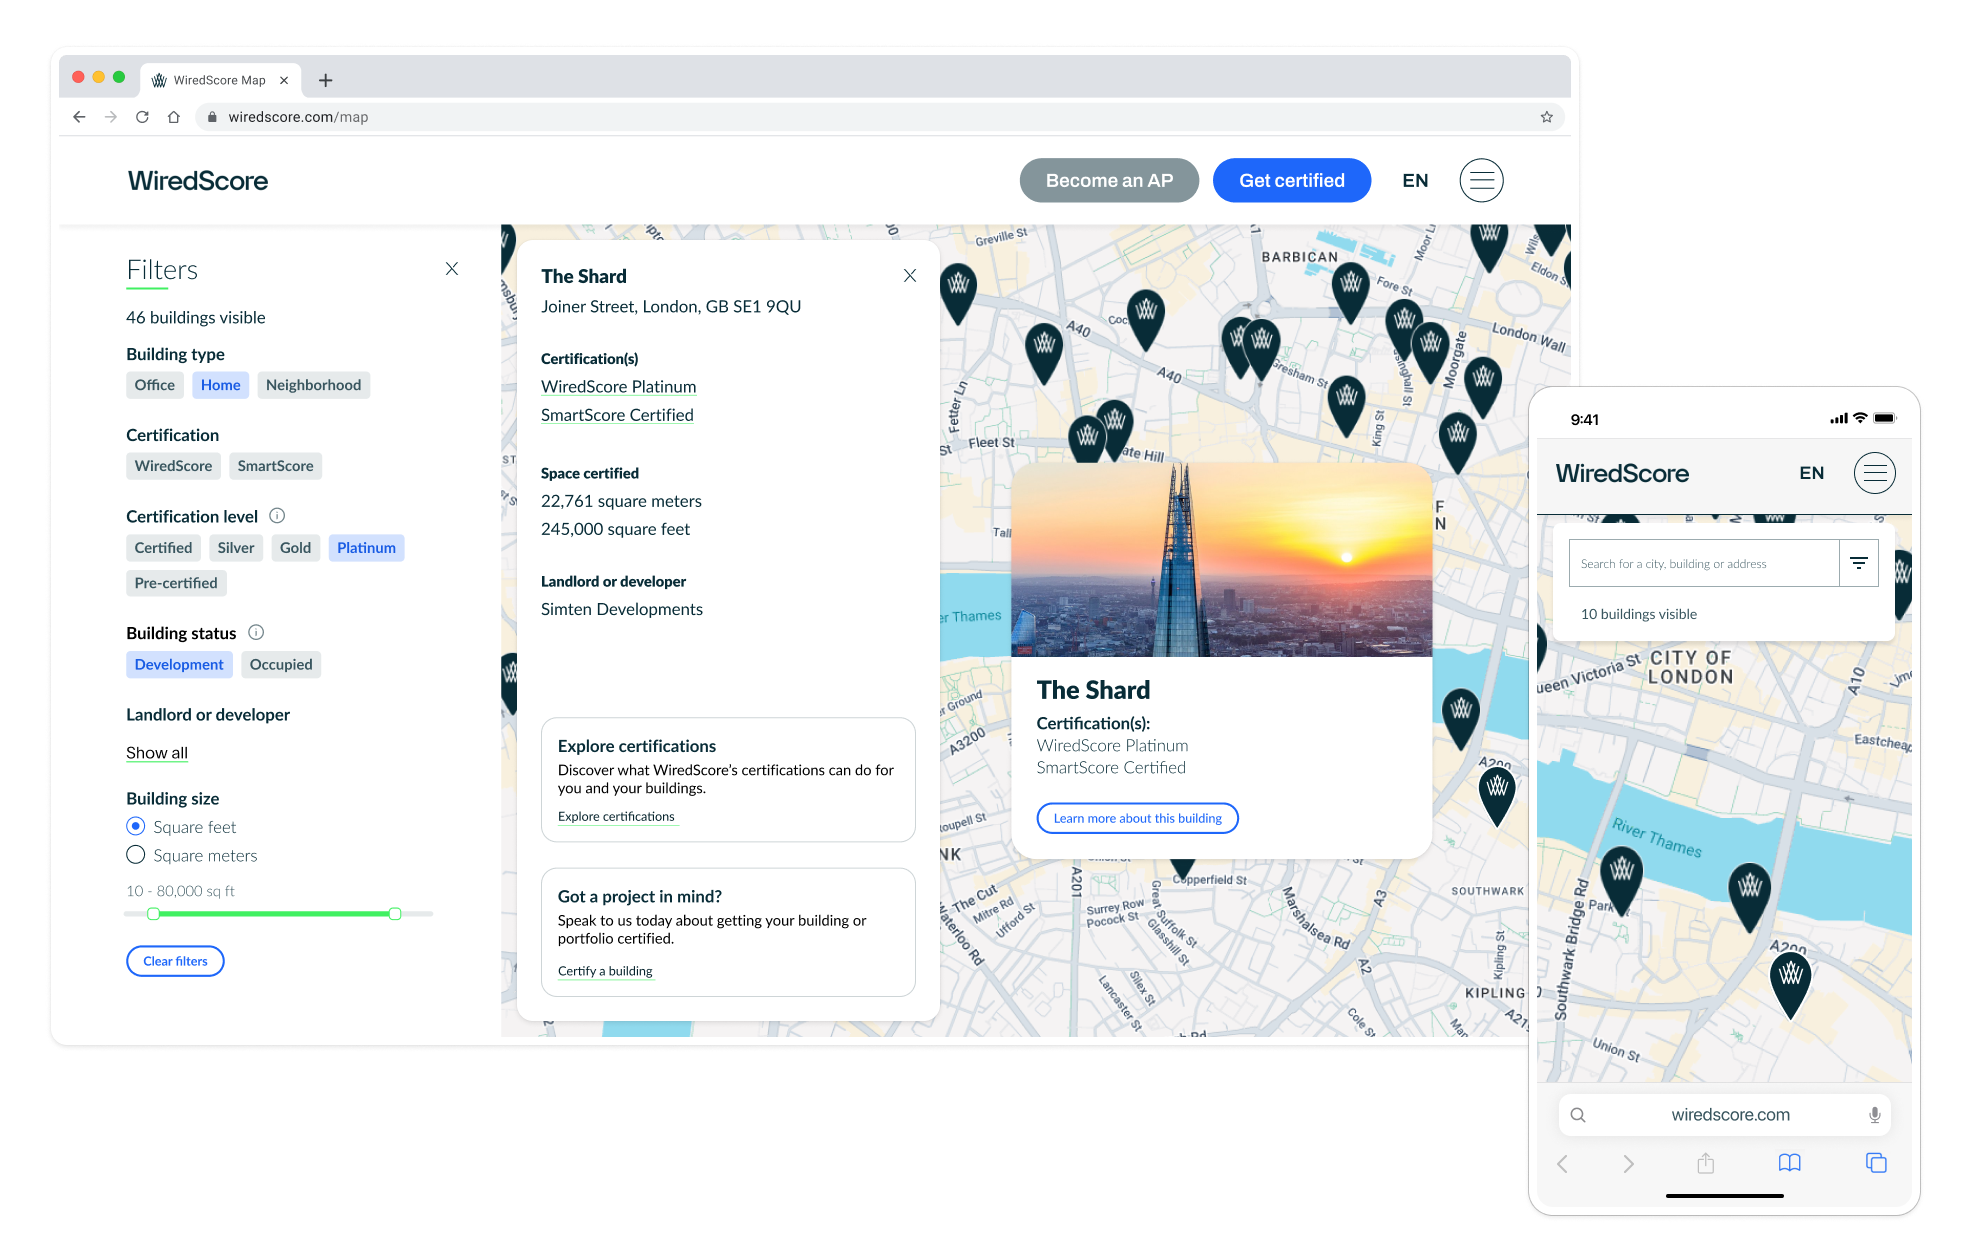
Preserving and elevating a vital sales asset through rapid redesign.
Outcomes:
- 3 day turn around.
- Sales tool kept online.
- Increased functionality.
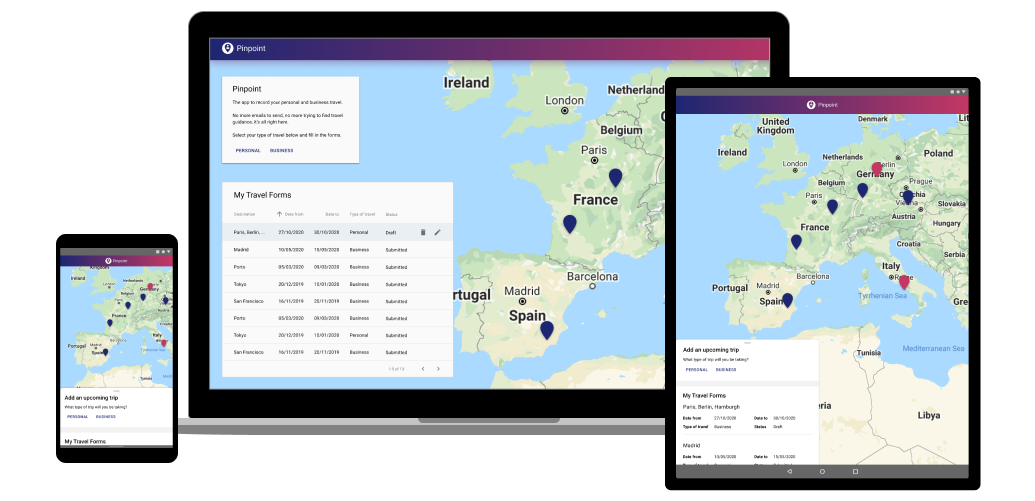
Transforming global staff safety. Building a better travel safety system.
Outcomes:
- Convinced business owners and senior software management to build the app.
- Secured 15 developers full-time for two weeks of dedicated work.
- The time to submit a Travel Form was reduced from 15 minutes to seven minutes.